Are there unlinked elements in the project?
Find elements with no detected links and check whether they are used.
GitHub · JavaScript/TypeScript · Vue · Python (test mode)
Choose a repository, branch, and folder. The JavaScript/TypeScript analyzer reads .js, .jsx, .ts, and .tsx; selected JSON, CSS/SCSS, and HTML files are added through detected static links. The Vue analyzer reads .vue, JavaScript, and TypeScript files with explicitly linked files. Python analysis reads .py files in test mode.
Understand the project structure faster, inspect module relationships, and assess the impact of changes before refactoring.
Public and private repositories · Source code is analyzed in your browser, not sent to the application server
You don't need to sign in to GitHub for a public repository.
Why it exists
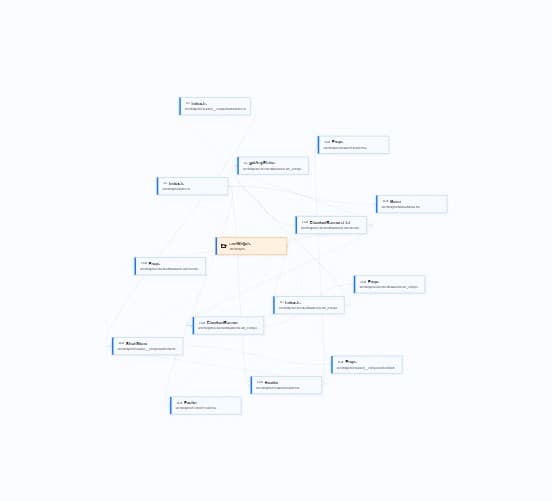
The graph shows detected static links between project files. Choose views to explore dependencies, compare shared and distinct files, or see which importers may be affected by a change.
Find elements with no detected links and check whether they are used.
Inspect a module's incoming and outgoing links before refactoring.
Trace imports in the graph and the list of related elements.
Choose an analyzer: JavaScript/TypeScript, Vue, or Python (test mode). The graph is built from detected static links and selected files.
How it works
Enter a public repository URL or connect GitHub for private access.

Modes and comparisons
The standard graph displays selected views and the static links found between them and other files. Following several components makes it easier to see which files they share and compare those common parts. This helps trace dependencies through the project and decide which modules to inspect before making a change.
Page structure heuristically identifies Page components and default exports from page.js, page.jsx, page.ts, and page.tsx files, then places them around the remaining components. This shows possible entry points and detected static links to the rest of the project. Selecting a page or component highlights those links; actual application routes are not reconstructed.
The project tree displays folders and components in their storage hierarchy, without dependency lines. It makes the repository's organization and each component's location easier to understand, so files can be found by folder before their links are explored in another view.
Change impact starts from a selected component and shows its direct importers at level one, followed by importers at each next level of reverse static links. This helps identify components to review before changing a file. The view reflects links found in source code and does not describe all runtime behavior.
File ranking sorts by the selected criterion: number of incoming links, number of outgoing links, or no detected links. It can surface files many others depend on and modules that import many dependencies, with unlinked nodes available as a separate criterion. A high link count can reveal hubs, but it does not measure code complexity. Check source files when no links are found.
Intersections show shared files for every selected pair and every larger combination. A file shared by three views also appears in each of the three pair groups.
Each combination includes files used by at least one view, but not all. In A+B+C, files used by one or two views remain; files shared by all three are excluded.
Features
Open a public GitHub repository without signing in. Use GitHub OAuth to choose a private one.
Choose one or more components as views and follow their detected dependency chains, including shared parts of the project.
Source files load from GitHub into your browser, where the dependency graph is built. They are not sent to the application server for analysis or stored in its database.
Get started without a subscription or payment card. GitHub API limits and repository access rules may apply.
Explore detected static links in JavaScript/TypeScript, Vue, and Python files.
Find files and elements with no detected links in the selected code. This does not establish whether they are used at runtime.
JavaScript/TypeScript: .js, .jsx, .ts, .tsx and selected JSON, CSS/SCSS, HTML · Vue: .vue, JS/TS and linked files · Python: .py (test mode).
The JavaScript/TypeScript analyzer reads .js, .jsx, .ts, and .tsx files. Selected JSON, CSS/SCSS, and HTML files are added through detected static links. The Vue analyzer reads .vue, JavaScript, and TypeScript with explicitly linked files. Python analysis reads .py files in test mode.
The graph reflects detected static links in the selected files, not all dynamic or runtime behavior. You can exclude build output, dependencies, and generated folders. A missing link does not prove that a file or component is unused.
Security
You can open a public repository without signing in. Private repositories require GitHub OAuth. Your browser loads the selected source files from GitHub and builds the graph locally. The application server exchanges an authorization code for a token, but does not receive project files for analysis.
The import graph and analysis are built in your browser
Source files are not sent to the application server or stored in its database
Reloading removes selected source files from the tab's memory
Reloading clears the loaded graph and authorization
GitHub OAuth is used to access private repositories
Selected source files load directly from GitHub into your browser
Check data transfers
FAQ
It maps detected static links between selected project files. It helps you trace relationships, but does not describe all dynamic or runtime behavior.
No. The tool runs in your browser. Open a GitHub repository, choose a branch and folder, then select an analyzer and its files.
No source files are sent there for analysis. Your browser loads the selected code from GitHub and builds the graph locally. The server participates in OAuth authorization for private repositories.
Sign in with GitHub OAuth, choose a private repository you can access, then select a branch, folder, analyzer, and files.
You don't need a subscription or payment card to get started. GitHub API request limits and account or repository access settings may still apply.
The loaded graph, selected elements, and authorization token are cleared from the tab's memory. To analyze the project again, choose its repository, branch, and source folder.
JavaScript/TypeScript analysis covers .js, .jsx, .ts, and .tsx; selected JSON, CSS/SCSS, and HTML files are added through detected static links. Vue analysis covers .vue, JavaScript, and TypeScript with explicitly linked files. Python analysis covers .py files in test mode. The graph reflects detected static links, not all dynamic or runtime behavior.
Open DevTools → Network and inspect the requests after choosing a repository. Source files load from GitHub into your browser. The application server handles OAuth authorization but does not receive project file contents.
How to use it
After loading a project, choose Export to download a JSON file with selected views, visibility, and filters. To restore it, load the same repository, branch, and root folder, choose Import, select the file, and confirm replacement. Source code is not included.
Select a component in the sidebar and add it to your views. The graph will show its dependency chain and the folders it uses. Add another view to compare architectures and find shared components.
The filters above the canvas show or hide selected file types and their links. Selecting a component keeps other nodes in place and highlights its direct connections. Use search to find a file or element in the graph.
Enter a name or path in Find a component above the canvas. Matches are highlighted on the graph while other models stay in place. Clear the search field to remove the highlight.
Choose a component in the sidebar and add it to your views. Repeat for other entry points: each architecture appears on its own row, making shared elements and connections easy to compare.
A dependency graph lets you see an application as more than a list of folders and files. It maps detected links between modules, showing which files import one another, what relates to a selected component, and where changing one module may affect other parts of the project. This is useful when exploring an unfamiliar GitHub repository, preparing a refactor, or reviewing architectural decisions.
JavaScript/TypeScript analysis covers .js, .jsx, .ts, and .tsx; selected JSON, CSS/SCSS, and HTML files are added through detected static links. Vue analysis covers .vue, JavaScript, and TypeScript with explicitly linked files. Python analysis covers .py files in test mode.
The graph reflects detected static links in the selected files, not every dynamic or runtime relationship. Public repositories can be explored without signing in; private ones require GitHub OAuth. Source files load from GitHub into your browser, where the graph is built.
Use the graph to explore project structure, plan changes, and discuss detected dependencies with your team.
Open a GitHub repository and choose a folder. JavaScript/TypeScript analysis covers .js, .jsx, .ts, and .tsx; selected JSON, CSS/SCSS, and HTML files are added through detected static links. Vue analysis covers .vue, JavaScript, and TypeScript with explicitly linked files. Python covers .py files in test mode. The graph shows detected static links, not all runtime behavior.
Build a dependency graphNo sign-in is needed to analyze a public GitHub repository.